리액트로 간단히 별점 종합 차트를 만들어보자. 마치 배민처럼!
먼저 컴포넌트 구성을 해준다.
<RatingsChart>
      <div className="card">
            <table>
                 <tbody>
                      <tr>
                        <td className="rating-label">Excellent</td>
                        <td className="rating-bar">
                          <div className="bar-container">
                            <div
                              className="bar"
                              style={{ width: `${ratingsAvg(starCount[4])}%` }}
                            ></div>
                          </div>
                        </td>
                        <td className="rating-count">{starCount[4]}</td>
                      </tr>
                      <tr>
                        <td className="rating-label">Good</td>
                        <td className="rating-bar">
                          <div className="bar-container">
                            <div
                              className="bar"
                              style={{ width: `${ratingsAvg(starCount[3])}%` }}
                            ></div>
                          </div>
                        </td>
                        <td className="rating-count">{starCount[3]}</td>
                      </tr>
                      <tr>
                        <td className="rating-label">Average</td>
                        <td className="rating-bar">
                          <div className="bar-container">
                            <div
                              className="bar"
                              style={{ width: `${ratingsAvg(starCount[2])}%` }}
                            ></div>
                          </div>
                        </td>
                        <td className="rating-count">{starCount[2]}</td>
                      </tr>
                      <tr>
                        <td className="rating-label">Poor</td>
                        <td className="rating-bar">
                          <div className="bar-container">
                            <div
                              className="bar"
                              style={{ width: `${ratingsAvg(starCount[1])}%` }}
                            ></div>
                          </div>
                        </td>
                        <td className="rating-count">{starCount[1]}</td>
                      </tr>
                      <tr>
                        <td className="rating-label">Terrible</td>
                        <td className="rating-bar">
                          <div className="bar-container">
                            <div
                              className="bar"
                              style={{ width: `${ratingsAvg(starCount[0])}%` }}
                            ></div>
                          </div>
                        </td>
                        <td className="rating-count">{starCount[0]}</td>
                      </tr>
                 </tbody>
            </table>
     </div>
</RatingsChart>
CSS는 styled-component를 이용하여 작성해준다.
const RatingsChart = styled.div`
  .card {
    padding: 30px 30px 20px 30px;
  }

  .rating-label {
    font-weight: bold;
    font-size: 15px;
  }

  .rating-box {
    width: 130px;
    height: 130px;
    margin-right: auto;
    margin-left: auto;
    background-color: #fcc419;
    color: #fff;
  }

  .rating-label {
    font-weight: bold;
  }

  /* Rating bar width */
  .rating-bar {
    width: 300px;
    padding: 4px;
    border-radius: 5px;
  }

  /* The bar container */
  .bar-container {
    width: 100%;
    background-color: #f1f1f1;
    text-align: center;
    color: white;
    border-radius: 20px;
  }

  /* Individual bars */
  .bar {
    height: 13px;
    background-color: #fcc419;
    border-radius: 20px;
  }

  td {
    padding: 0px 0px 8px 0px;
  }

  .rating-count {
    font-size: 15px;
  }
`;
별점 매기기 기능과 마찬가지로 차트 바가 노란색으로 채워지도록 하는 컴포넌트의 width를 항목별로 계산하여 설정해주어야 한다.
그렇다면 계산을 해보자.
starCount 배열안의 각 요소는 0점부터 5점까지 별점을 매긴 유저 수를 나타낸다. 0번째 요소가 0점을 매긴 유저 수의 합, 4번째 요소가 5점을 매긴 유저 수의 합이 된다.
"starCount": [0, 0, 0, 1, 3]percentage 계산을 위해 별점을 매긴 유저의 총합을 먼저 구해주자.
 // 평점 매긴 유저 수 총합
  const ratingsTotal = starCount.reduce(
    (acc: number, cur: number) => (acc += cur),
    0
  );
width 속성에 percentage 계산 값을 넣어 적용해주어야 하므로 inline styling을 사용해야한다.그에 따른 함수를 하나 만들어주자.
const ratingsAvg = (el: number) => (el / ratingsTotal) * 100;이 함수는 아규먼트가 starCount 배열의 각 요소이며, 리턴값은 그 아규먼트 값을 percentage로 변환한 값이 된다.
<div className="bar-container">
    <div
       className="bar"
       style={{ width: `${ratingsAvg(starCount[4])}%` }}
    ></div>
</div>
결과는?!
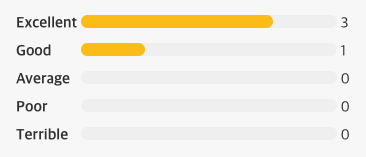
노랑노랑한 예쁜 차트를 볼 수 있다!
참고한 블로그
https://bbbootstrap.com/snippets/rating-and-review-system-user-comment-section-41283119
Bootstrap 4 rating and review system with user comment section Example
Bootstrap 4 rating and review system with user comment section snippet for your project 📌📌. this snippet is created using HTML, CSS, Bootstrap 4, Javascript
bbbootstrap.com
'코드스테이츠 SEB FE 41기 > Main-Project(MatP)' 카테고리의 다른 글
| [react & typescript] useAxios 커스텀 훅 사용기2 - 데이터 실시간 업데이트해보기 (0) | 2023.01.31 |
|---|---|
| [react & typescript] MUI Popover 사용기(Delete confirm 기능) (0) | 2023.01.31 |
| [react] star-rating 구현하기 2탄(이번엔 소수점까지!) (0) | 2023.01.25 |
| [react & typeScript]'개체가 null인 것 같습니다' 에러 해결하기 (0) | 2023.01.25 |
| [react & typescript] useRef 사용시 "개체가 null(undefined)인 것 같습니다" 에러 해결하기 (0) | 2023.01.25 |


